Care Team Reporting Trends
2025-2026 Reporting
2,350
Total Referrals
1,587
Unique Students
Reported Concerns Per Month
The table below shows reported concerns per month for 2025-2026. This table is updated each month to reflect the newest reporting data. Please note: a single report may involve more than one reported concern, so these totals may not be the same as the total number of reports.
| Area | July | August | September | October | November | December | January | February | March | April | May | June | TOTALS |
| TOTALS | 54 | 83 | 330 | 475 | 438 | 212 | 228 | 363 | 388 | 302 | 133 | 3,006 | |
| Academic Difficulty | 11 | 14 | 71 | 134 | 84 | 42 | 39 | 89 | 96 | 73 | 25 | 678 | |
| Alcohol or Substance Use | 1 | 0 | 0 | 4 | 5 | 3 | 2 | 4 | 0 | 2 | 2 | 23 | |
| Bereavement | 4 | 4 | 21 | 39 | 22 | 9 | 14 | 19 | 21 | 28 | 3 | 184 | |
| Excessive Absences | 1 | 9 | 65 | 80 | 52 | 26 | 38 | 88 | 80 | 47 | 4 | 490 | |
| Financial and/or Housing | 12 | 3 | 25 | 19 | 30 | 15 | 22 | 19 | 20 | 21 | 11 | 197 | |
| Mental Health | 9 | 11 | 37 | 72 | 82 | 55 | 42 | 50 | 54 | 52 | 19 | 483 | |
| Physical Health | 4 | 12 | 31 | 35 | 31 | 16 | 14 | 25 | 26 | 21 | 7 | 222 | |
| Relationship Issues | 2 | 3 | 17 | 17 | 28 | 9 | 6 | 11 | 11 | 6 | 9 | 119 | |
| Suicide or Self-Harm | 0 | 2 | 1 | 6 | 15 | 8 | 6 | 6 | 6 | 1 | 7 | 58 | |
| Unusual Behavior | 4 | 5 | 8 | 14 | 15 | 2 | 9 | 7 | 12 | 7 | 7 | 90 | |
| Victim or Witness to Incident | 1 | 4 | 11 | 8 | 17 | 9 | 3 | 5 | 14 | 15 | 10 | 97 | |
| Other or Unclassified | 5 | 16 | 43 | 47 | 57 | 18 | 33 | 40 | 48 |
29 |
29 | 365 |
Prior Year Data
The chart and table below show year-over-year trends for reports by reporting source for academic year 2021-2022 through academic year 2024-2025. This data will be updated each year in July once the prior year has completed.
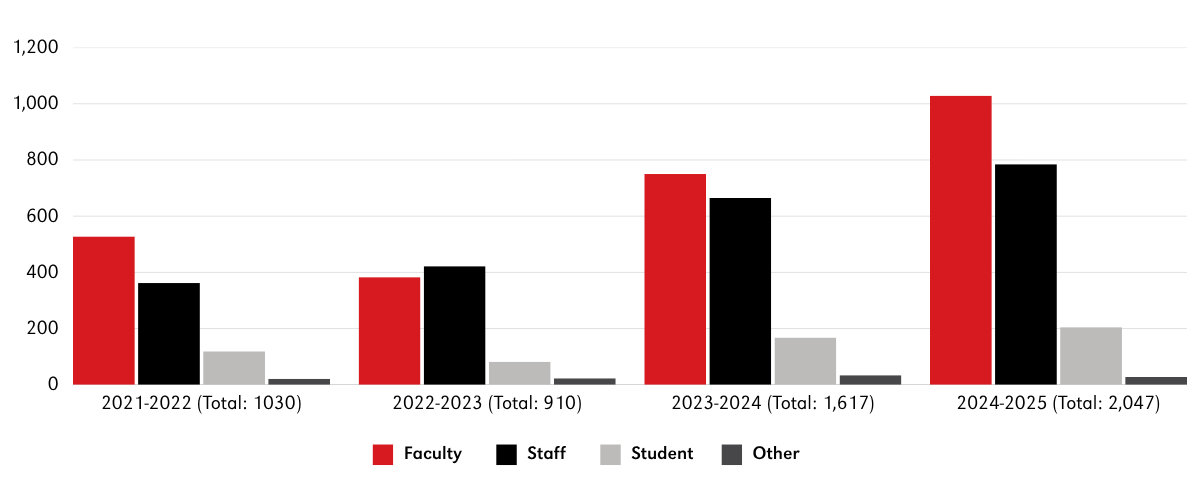
Reports by Source by Year
The table below shows year-over-year trends for reports by reporting source from academic year 2021-2022 through academic year 2024-2025.
| Year | Faculty | Staff | Student | Other | Totals |
|---|---|---|---|---|---|
| 2021-2022 | 528 | 362 | 119 | 21 | 1,030 |
| 2022-2023 | 383 | 422 | 82 | 23 | 910 |
| 2023-2024 | 750 | 665 | 168 | 34 | 1,617 |
| 2024-2025 | 1,029 | 785 | 205 | 28 | 2,047 |